2026: Volume 5, Issue 1
Current Issue
 Abstract
  PDF
PDFGibbs Free Energy and Epidemic Models: A Framework for Control Strategies
Anderson A. Nogueira1,2,3*, Antonio S. S. Santos2 and Gabriel B. de Gracia4
1Santa Catarina State University, Department of Physics, Joinville, 89219-710, SC, Brazil
2Federal University of Alfenas, Institute of Exact Sciences, Alfenas, 37133-840, MG, Brazil
3Federal University of Itajubá, Institute of Physics and Chemistry, Itajubá, 37500-903, MG, Brazil
4Federal University of Triângulo Mineiro, Department of Physics, Uberaba, 38025-180, MG, Brazil
*Corresponding author: Anderson Antunes Nogueira, Santa Catarina State University, Department of Physics, Joinville, 89219-710, SC, Brazil, E-mail: [email protected]
Received Date: June 30, 2025 Published Date: March 11, 2026
Citation: Nogueira AA. (2026). Gibbs Free Energy and Epidemic Models: A Framework for Control Strategies. Catalysis Research.5(1):20.
Copyright: Nogueira AA, et al. © (2026).
ABSTRACT
This work introduces a novel thermodynamic framework for epidemic modeling by establishing a direct relationship between the effective reproductive number Rt and the Gibbs free energy, Δ G = -E ln(Rt). We explore how epidemic transitions can be interpreted as phase transitions, drawing a formal analogy with spontaneous and catalyzed chemical reactions. Building on the analytical structure of SIR and SEIR models, we estimate Rt for SARS-CoV-2 using confirmed case data from a regional health authority, applying both the serial interval distribution (log-normal) and an alternative linear regression approach based on doubling time. This thermodynamic perspective provides a deeper physical interpretation of epidemic dynamics and opens new avenues for predicting and controlling community transmission.
Keywords: Deterministic Compartmental Models, Dynamics of Social Systems, Collective Phenomena, Spontaneous and Catalytic Chemical Reactions, Data Analysis, Thermodynamics
INTRODUCTORY CONCEPTS
As is well known, dynamical systems have broad applicability in describing collective phenomena in physical systems, biological processes, and social dynamics [1-8], and within this branch of mathematics are deterministic models and the study of the dynamics of infectious diseases [9-12]. In this context, the simplest systems of differential equations that can describe the transmission dynamics of a virus within a community are the SIR (Susceptible, Infected, Recovered) and SEIR (Susceptible, Exposed, Infected, Recovered) models, along with their variations [13-26]. Within this study of transmission dynamics, the concept of the reproductive number (basic/effective) naturally arises as a measure of transmissibility, making it a crucial quantity for understanding the spread. Several methods have been developed to estimate the average number of secondary cases caused by a single infected individual during their infectious period over the course of an epidemic (Rt), and some of these tools deserve our attention [27-29].
The average time it takes for an infecting individual (primary case) to transmit the infection to a secondary case, expressed in terms of a distribution, can be used to calculate the effective or instantaneous reproductive number Rt. This distribution is built from data collected by health agents through interviews conducted at the onset and during the course of the outbreak. It informs us about the speed of cycles in the transmission chain and is generally approximated (proxy) by the serial interval [30]. The serial interval is defined as the duration between the onset of symptoms in a primary case (infector) and the onset of symptoms in a secondary case (infected). Finally, as an alternative yet complementary approach, we can also obtain Rt using local behavior involving exponential growth, linear interpolation, and the relationship between the reproductive number (basic/instantaneous) and the doubling time [31,32].
The theoretical foundations involving the reproductive number and its relationship with reality—considering that many key characteristics of disease transmission cannot be directly observed—are currently an active area of research [33]. Thus, our goal is to present in a solid manner the concepts involving this elusive number R and how understanding it from different perspectives leads to a deeper view of the study of virus transmission dynamics in a community.
Thermodynamic and physical approaches to complex systems have been extensively explored in the literature, particularly in the context of epidemics and pandemics [34,35]. By analyzing the SIR model as a chemical reaction involving both spontaneous and catalytic processes, and applying the law of mass action, it is possible to establish a relationship between the Gibbs free energy and the chemical equilibrium constant. In this article, we propose a novel connection between the reproductive number and the Gibbs free energy, expressed as [36,37].
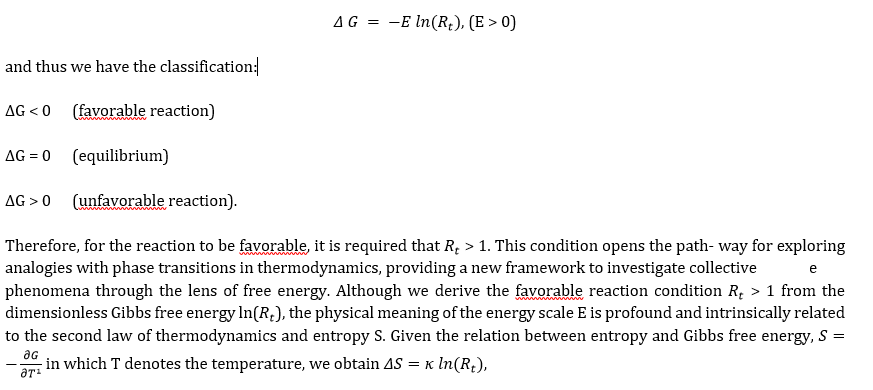
wherein we employ the condition from chemical equilibrium E = kT. Here, k denotes the Boltzmann constant. So the entropy of the system never decreases
As is well known, entropy has proven to be a fundamental tool for the analysis of some biosystems [38-40]. Entropy-based metrics also provide insights into control strategies, as reducing entropy can be associated with effective interventions. The modern interpretation of entropy in the context of SIR epidemiological models general use Shannon information-theoretic perspective [41-43]. The distribution of individuals among compartments can be treated as a probabilistic state, allowing the use of Shannon entropy to quantify the uncertainty and disorder in the population. Moreover, the epidemic dynamics can be understood as an irreversible process characterized by entropy production, which often peaks near the turning points of the infection curve.
In this work, we present an interdisciplinary review that bridges classical epidemiological models, such as SIR and SEIR, with concepts from statistical physics and thermodynamics, particularly through a novel connection between the effective reproductive number Rt and the Gibbs free energy. By proposing the relation ΔG = E ln(Rt), we reinterpret epidemic transitions as phase transitions, offering a fresh physical perspective on the dynamics of viral spread within populations. Beyond the theoretical framework, we apply this approach to real-world epidemiological data, analyzing COVID-19 transmission in a specific region of Brazil using the EpiEstim tool. This synthesis of mathematical modeling, physical analogy, and empirical analysis provides new insights into how physical methodologies can enrich our understanding of collective epidemiological phenomena and the effectiveness of control measures. The article is organized as follows. In Sec.2, we present the simplest model that can describe virus transmission dynamics (SIR). In Sec.3, we refine the SIR model considering intervention measures (social distancing, mask usage, quarantine, and vaccines). In Sec.4, we investigate a more realistic model (SEIR), taking into account the incubation period. We also summarize how all the previous investigations of the SIR and SEIR models—considering the vast number of variables—influence the spread of a virus within a population. In Sec.5, we derive the relationship between the reproductive number and the Gibbs free energy, and we present the phase transition diagram. In Sec.6, we calculate the reproductive number of a specific macro-region monitored by a regional health authority, using the serial interval. We place this investigation within the context of a phase transition by defining an average variation of the Gibbs free energy and studying the transition using appropriate variables. Finally, in Sec.7, we present our conclusions.
EPIDEMIC DYNAMICS DESCRIBED BY THE SIR MODEL
The simplest mathematical framework capable of describing the transmission dynamics of a virus is given by the following set of equations
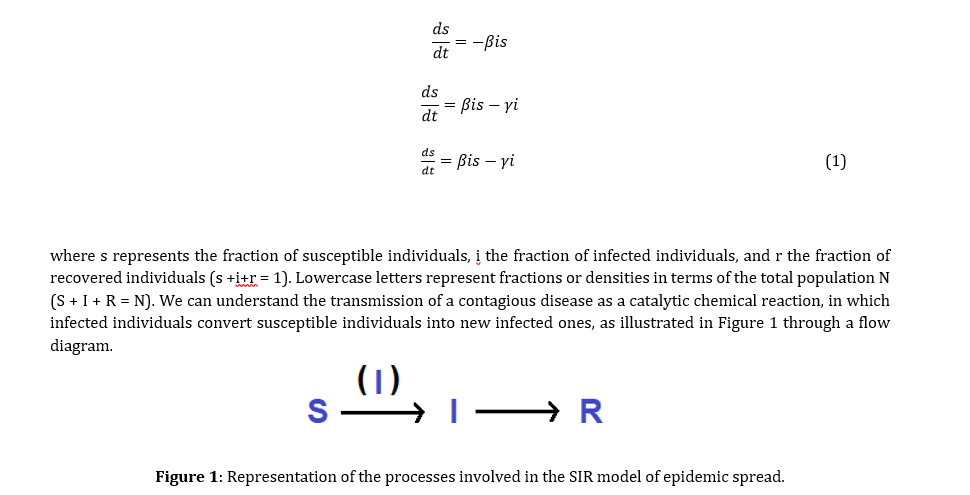
The classes of individuals are: susceptible (S), infected (I), recovered (R). An I in parentheses indicates that the process is catalytic, with I acting as the catalyst. The other processes are spontaneous.
Note that the system has the following disease-free equilibrium point: (s, i, r) = (1, 0, 0). The inverse of the rates has the dimension of time, with the transmission rate given by β=cp, where C is the average number of daily contacts (network), p is the probability of infection per contact, and 1/ γ is the average recovery time for an infected individual.
The variation of the fraction of infected individuals i is given by:
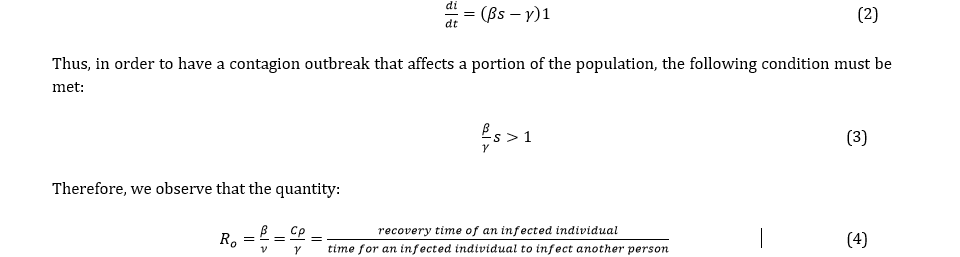
indicates that at the beginning of the outbreak (s = 1), the infection rate exceeds the recovery rate.
Suppose that on average a person meets 5 others per day, with an infection probability of 0.05. Thus, an infected individual infects 0.25 people per day, and in 4 days, infects one person. If the recovery time is approximately 12 days (about 2 weeks), the basic reproduction number R0 would be 3, which can be visualized in Figure 2 in terms of generation chains.
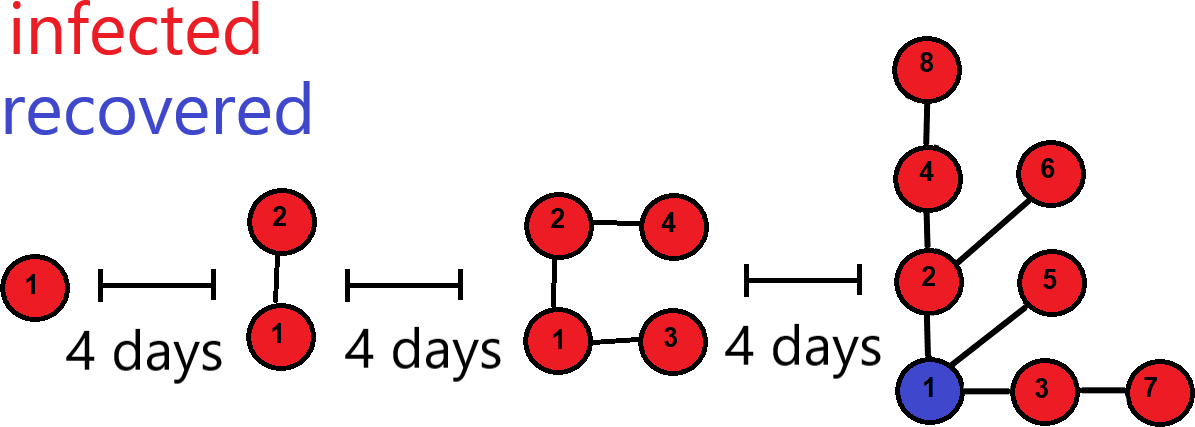
Figure 2: The basic reproduction number Ro and the chain of generations.
Thus, the basic reproduction number Ro represents a threshold for the transmission dynamics: Ro>1 implies that there will be no significant transmission and spread of the virus within a community. The interpretation of the reproduction number is the average number of people that an infected individual will infect before recovering, as clearly seen in Eq. (4).
The epidemic spreads when the reaction rate β reaches a critical value (β = γ), leading to a phase transition analogous to what occurs in thermodynamics with a critical temperature. Therefore, the number of individuals that an infected person infects on average is given, from Eq. (2), by the definition of an effective reproduction number Reff:

where the basic reproduction number is the effective reproduction number evaluated at the disease- free equilibrium point (s, i, r) = (1, 0, 0).
The system of equations in Eq. (1) has very useful properties when applying the SIR model to describe the transmission dynamics of a disease within a community.
The first property relates to the initial behavior of the transmission dynamics. Since at the beginning of the outbreak s ≈ 1, from the second equation in the system (1) we obtain:
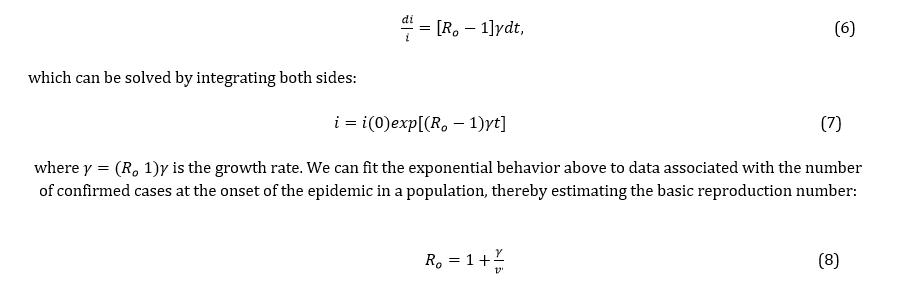
The second property concerns the final behavior t → ∞ of the transmission dynamics. By dividing the second equation of the system (1) by the first, we obtain
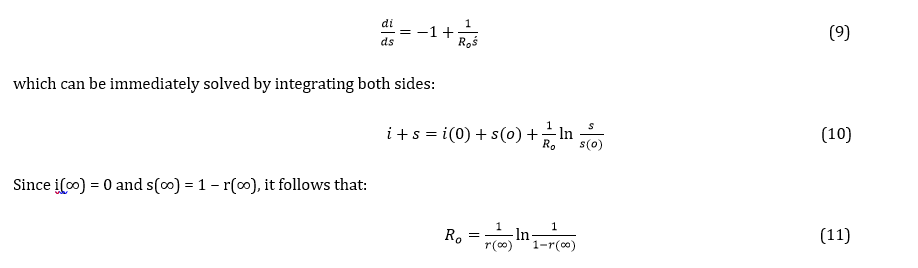
Thus, the basic reproduction number can be expressed in terms of the fraction of the population that was infected and recovered (r), and vice versa. By conducting serological (antibody) surveys within a population, we can estimate this fraction (prevalence) and consequently the basic reproduction number.
By numerically solving Eq. (11), we can determine the percentage of the population that would be infected by a disease for a given basic reproduction number (attack rate), as shown in Figure 3.
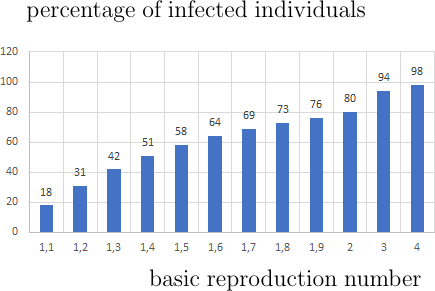
Figure 3: Total percentage of infected individuals as a function of the basic reproduction number.
Now let us suppose that a fraction of the infected individuals die due to the infection’s mortality rate. In this case, by introducing a new class representing deaths (m), the system of equations becomes (SIRM):
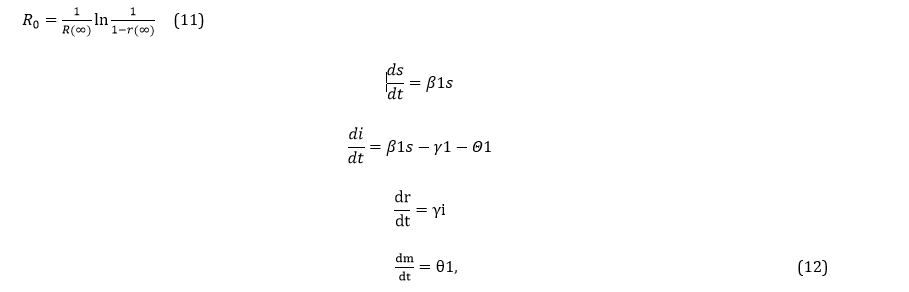
where 1/θ is the average time until death for an infected individual. The system of Eqs. (12) is represented by the diagram in Figure 4.
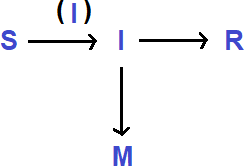
Figure 4: Representation of the processes involved in the SIRM model of epidemic spread. The classes of individuals are: susceptible (S), infected (I), recovered (R), and deceased (M).
We can organize the above system as follows:
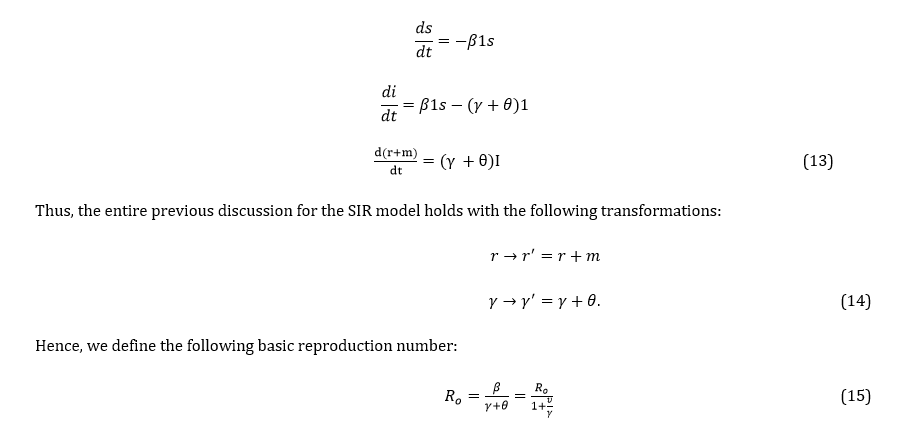
If the mortality rate θ increases, the basic reproduction number decreases. Consequently, in diseases with a high mortality rate, an infected individual may not have enough time to infect others, thus preventing the spread of the disease.
Moreover, the equations describing the initial and final behavior of an epidemic are given by:

respectively. If the infection fatality rate is very low, we recover the SIR model.
Finally, let us introduce a vital dynamic into the SIRM model, through the daily birth rate λ
and death rate κ:

The system of Eqs. (17) is represented by the diagram in Figure 5.
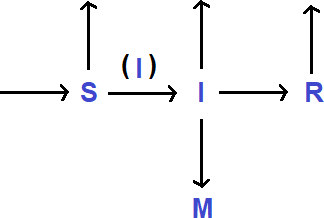
Figure 5: Representation of the processes involved in the SIRM model with vital dynamics.
The classes of individuals are: susceptible (S), infected (I), recovered (R), and deceased due to viral infection (M). The arrows entering and exiting the diagram represent the fluxes associated with the population’s birth and death rates, respectively.
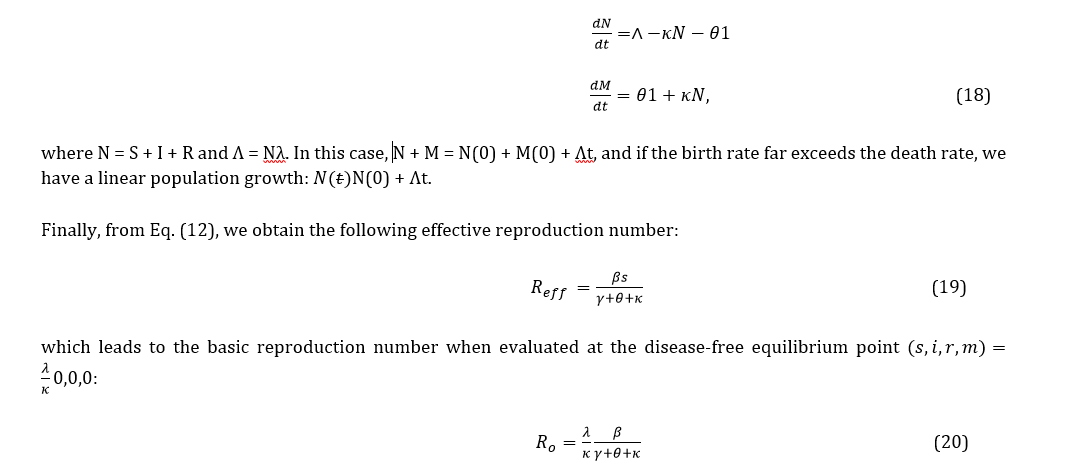
We can organize the above system as follows:
(EXTERNAL/INTERNAL) INFLUENCES ON EPIDEMIC DYNAMICS AND INTERVENTION MEASURES
We are now prepared to refine the previous discussion by implementing how intervention measures could affect the previous equations and their respective consequences [19-26].
Social Distancing or Herd Immunity
Let us suppose that a virus encounters a population in which a certain fraction is already immune or practices social distancing (mitigation), with (s1 = (1 -x)s. representing the fraction of the population that does not practice social distancing or is not immune, and s2 = xs representing the fraction that does practice social distancing or is immune (s = s1 + s2). Considering the SIR model discussed earlier, the transmission dynamics would be given by the following equations:

We represent Eqs. (21) with the diagram in Figure 6.
Since the transmission of the virus to people practicing social distancing or with immunity is practically null (β1 = β, β2 = 0), we have:

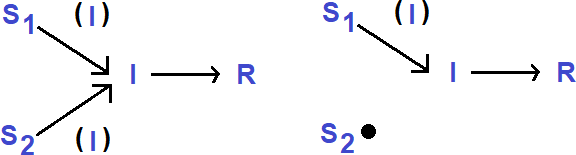
Figure 6: Representation of the processes involved in the SIR epidemic spread model with herd immunity or an equivalent control measure.
The classes of individuals are: susceptible (S1) without immunity, susceptible (S2) with immunity, infected (I), and recovered (R). Infected individuals (catalysts) react differently with susceptible individuals. When β1 = β2 = β or one of the transmission rates is null, we recover the classic SIR model. Immunity or social distancing suppresses the reaction  disabling this type of interaction between susceptible and infected individuals, represented by the disappearance of the arrow indicating the flow of individuals from one class to another.

Thus, we can write the following effective reproductive number:

so that increasing the fraction x reduces the reproductive number. To control the epidemic:

Therefore, to control an epidemic, a certain percentage of the population must be immunized, or the control measure must be equally effective, as shown in Figure 7.
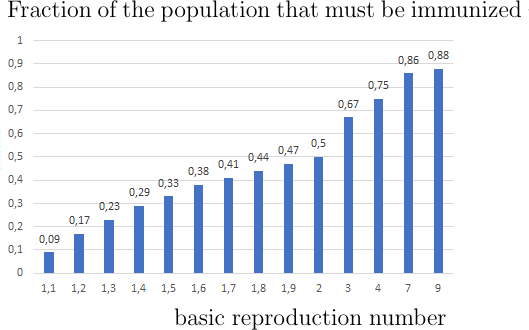
Figure 7: Fraction of the population that must be immunized as a function of the basic reproductive number.
Use of Masks and Hand Washing
Let us consider a population N divided between individuals who use masks and those who do not, with S1 representing the fraction of individuals who use masks, S2 the fraction who do not, i1 the fraction of infected individuals who use masks, and i2 the fraction of infected individuals who do not use masks. Considering the SIR model discussed previously and also that:
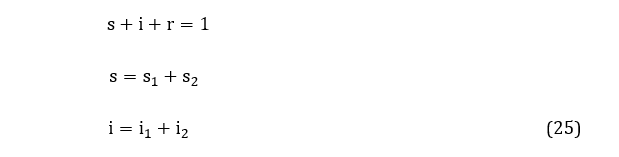
and assuming that mask-wearing, along with hand washing or an equivalent control measure, reduces the transmission probability of infected individuals to  , where ϵ1 is the efficiency (e.g., of the mask) in reducing transmissibility between infected and susceptible individuals, we obtain the following:
|
Contact Probability |
Infected with Mask |
Susceptible with Mask |
Transmission Chance |
|
i1s1 |
Yes |
Yes |
β(1 − ϵ1) |
|
i1(s − s1) |
Yes |
No |
β(1 − ϵ1) |
|
(i − i1)s1 |
No |
Yes |
β |
|
(i − i1)(s − s1) |
No |
No |
β |
In this case, we would have the following system of differential equations describing the transmission dynamics of the virus in a heterogeneous population composed of individuals who use and do not use masks:
.png)
Therefore, defining the effective reproductive number as:

we conclude that increasing either the fraction of infected individuals who use masks (i1/i) or the efficacy ϵ1 of the mask reduces the transmission rate and consequently the reproductive number. In general, assuming also that masks, hand washing, or equivalent control measures protect susceptibles with an efficiency ϵ2, then  We represent Eqs. (26) with the diagram in Figure 8. Thus, from the system of equations in Eq. (27), we obtain the following effective reproductive number:

In this case, if we increase the fraction of infected individuals (i1) or susceptible individuals (s1) who use masks, and also the efficacy of the mask in reducing the transmission from infected individuals (ϵ1) or preventing contagion of susceptibles (ϵ2), we reduce the effective reproductive number and possibly control an epidemic.
For simplification, assuming that ϵ1= ϵ2 = ϵ and i1/i = s1/s = ρ, we have the following (effective/basic) reproductive number:

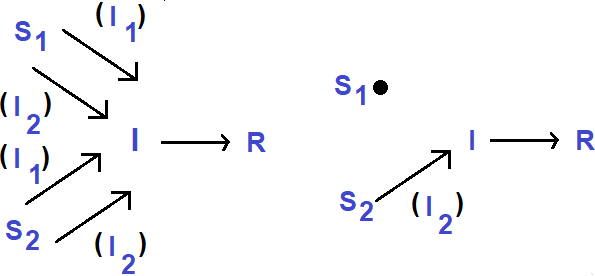
Figure 8: Representation of the processes involved in the SIR epidemic spread model with mask usage, hand washing, or equivalent control measures.
The classes of individuals are: susceptible (s1) who use masks, susceptible (s2) who do not use masks, infected (i1) who use masks, infected (i2) who do not use masks, and recovered (R). Infected individuals (catalysts) react differently with susceptible individuals. When  , we recover the classic SIR model. The control measures of mask-wearing and hand washing suppress the reactions
  . disabling these types of interactions between susceptibles and infected, represented by the disappearance of the arrows indicating the flow of individuals from one class to another.
REFERENCES
- Adam JA (2003). Mathematics in Nature-Modeling Patterns in Natural World, 1st edn. (Princeton University Press, Princeton.
- Mitchell M. (2011). Complexity: A Guided Tour, 1st Edition (Oxford University Press, Oxford,).
- West G. (2017). Scale: The Universal Laws of Growth, Innovation, Sustainability, and the Pace of Life in Organisms, Cities, Economies, and Companies, 1st edn. (Penguin Press).
- Kauffman SA. (1993). The Origins of Order: Self-Organization and Selection in Evolution, 1st edn. (Oxford University Press, Oxford.
- Balian R. ((2007). From Microphysics to Macrophysics vols I e II, 1st. edn. (Springer, New York,).
- Thurner S, Hanel R, Klimek P. (2018). Introduction to the Theory of Complex Systems, 1st. edn. (Oxford University Press, Oxford).
- Jensen HJ. (2023). Complexity Science, 1st. edn. (Cambridge University Press, Cambridge).
- Tsallis C. (2023). Introduction to Nonextensive Statistical Mechanics- Approaching a Complex World, 2nd. edn. (Springer, New York,).
- Apostol TM. (1991). Calculus vol. 2, Multi-Variable Calculus and Linear Algebra with Applications to Differential Equations and Probability, 2 ed. (John Wiley and Sons, New York).
- Hirsch MW, Smale S, Devaney RL. (2013). Differential Equations, Dynamical Systems, and an Introduction to Chaos, 3rd edn. (Academic Press, Massachusetts,).
- Keeling MJ, Rohani P. (2007). Modeling Infectious Diseases in Humans and Animals, (Princeton University Press, Princeton,).
- Brauer F, Chavez CC, Feng Z. (2019). Mathematical Models in Epidemiology, (Springer, New York,).
- Nogueira AA. (2023). Modelos Epidˆemicos com A¸co˜es Controladoras e Breves Aplica¸co˜es: Ciˆencia de Dados com Ferramentas online, 1st. edn. (Dial´etica, Sa˜o Paulo,).
- Tom´e T, de Oliveira MJ. ((2020). Epidemic spreading. Rev. Bras. Ens. F´ıs. 42, e20200259.
- Batista AM, Souza SL, Larosz KC, Almeida AC, Szezech JD, Gabrick EC, et al. (2021). Simulation of deterministic compartmental models for infectious diseases dynamics. Revista Brasileira de Ensino de Física. 43:e20210171.
- Teles P. (2020). Modelos compartimentais e aplicacoes. Revista de Ciência Elementar. 8 (2):024.
- Kermack WO, McKendrick AG. (1991). A contribution to the mathematical theory of epidemics --I. 1927. Bulletin of Mathematical Biology. 53(1-2):33-55.
- Li MY, Muldowney JC. (1995). Global stability for the SEIR model in epidemiology. Mathematical biosciences. 125 (2):155.
- Yan J, Guha S, Hariharan P, Myers M. (2019). Modeling the Effectiveness of Respiratory Protective Devices in Reducing Influenza Outbreak. Risk Aalysis. 39(3):647-661.
- Howard J, Huang A, Li Z, Tufekci Z, Zdimal V, van der Westhuizen HM, et al. (2021). An evidence review of face masks against COVID-19. Proc Natl Acad Sci U S A. 118(4):e2014564118.
- Hethcote H, Zhien M, Shengbing L. (2002). Effects of quarantine in six endemic models for infectious diseases. Mathematical Biosciences. 180:141-60.
- Pedersen MG, Meneghini M (2020). Data analysis and modeling of the evolution of COVID-19 in Brazil.
- Crokidakis N. (2020). Modeling the early evolution of the COVID-19 in Brazil: results from a Susceptible-Infectious-Quarantined-Recovered (SIQR) model. Int. J. Mod. Phys. C 31:2050135.
- Chae SY, Lee KE, Lee HM, Jung N, Le QA, Mafwele BJ, et al. (2020). Estimation of Infection Rate and Predictions of Disease Spreading Based on Initial Individuals Infected With COVID-19 Vaccination as a Control of Infectious Diseases. Frontiers in Physics. 8:311.
- Baafi et al. (2017). Vaccination as a Control of Infectious Diseases. Journal of Applied & Computational Mathematics. 6:3:357.
- driessche PV. (2017). Infectious Disease Modelling. 29;2(3):288-303.
- Wallinga J, Teunis P. (2004). Different epidemic curves for severe acute respiratory syndrome reveal similar impacts of control measures. American Journal of Epidemiology. 160(6):509.
- Cori A, Ferguson NM, Fraser C, Cauchemez S. (2013). A new framework and software to estimate time-varying reproduction numbers during epidemics. American Journal of Epidemiology. 1;178(9):1505-1512.
- Thompson RN, Stockwin JE, van Gaalen RD, Polonsky JA, Kamvar ZN, Demarsh PA, et al. (2019). Improved inference of time-varying reproduction numbers during infectious disease outbreaks Epidemics. 100356.
- Nishiura H, Linton NM, Akhmetzhanov AR. (2020). Serial interval of novel coronavirus (COVID-19) infections. International Journal of Infectious Diseases. 93:284-286.
- Ma J. (2020). Estimating epidemic exponential growth rate and basic reproduction number. Infectious Disease Modelling. 8:5:129-141.
- Bonifazi G, Lista L, Menasce D, Mezzetto M, Pedrini D, Spighi R, et al. (2021). A simplified estimate of the effective reproduction number Rt using its relation with the doubling time and application to Italian COVID-19 data. European Physical Journal Plus. 136(4):386.
- Park SW, Sun K, Champredon D, Li M, Bolker BM, Earn DJD, et al. (2021). Forward-looking serial intervals correctly link epidemic growth to reproduction numbers. Proc Natl Acad Sci U S A. 12;118(2):e2011548118.
- Lucia U, Deisboeck TS, Grisolia G. (2020). Entropy-Based Pandemics Forecasting, Frontiers in Physics. 8.
- Mondaini L, Meirose B, Mondaini F. (2021). Second Quantization Approach to COVID-19 Epidemic. Biophysical Reviews and Letters. 16:4:143-154.
- Schrodinger E. (1973). Statistical Thermodynamics. 1st edn. (Cambridge University Press, Cambridge 1952). W. Pauli, Statistica Mechanics, 1st edn. (MIT Press, Cambridge).
- Nogueira AA, Santos ASS, de Gracia GB. ((2025). Epidemic models with controlling actions: a Gibbs free energy approach. The European Physical Journal Plus. 140:834.
- Harding N, Nigmatullin R, Prokopenko M. (2018). Thermodynamic efficiency of contagions: a statistical mechanical analysis of the SIS epidemic model. Interface Focus. 8:20180036.
- Scarpino SV, Petri G. ((2019). On the predictability of infectious disease outbreaks. Nature Communications.
- Lucia U, Grisolia G. (2018). Second law efficiency for living cells. Frontiers in Bioscience. 9(2):270-275.
- Jaynes ET. Gibbs vs Boltzmann Entropies. (1965). American Journal of Physics. 33: 391–398.
- Jaynes ET. (1992). The Gibbs paradox. Maximum Entropy and Bayesian Methods, 1st. edn. (Kluwer Academic Publishers, Dordrecht).
- Lucia U. (2013). Thermodynamic paths and stochastic order in open systems. Physics A. 392:3912-3919.
- Heffernan JM, Smith RJ, Wahl LM. (2005). Perspectives on the basic reproductive ratio. Journal of the Royal Society, Interface. 22;2(4):281-293.
- Heng K, Althaus CL. (2020) The approximately universal shapes of epidemic curves in the Susceptible-Exposed-Infectious-Recovered (SEIR) model. Scientific Reports. 10(1):19365.
- de Souza Kock K, et al. (2017). Cálculo da taxa de reprodutividade (R0) através da simplificação do modelo SIR aplicado à epidemia de influenza A (H1N1) ocorrida em 2009 no Brasil. Revista de Epidemiologia e Controle de Infecção. 7(2):72-78.
- Atkins P, de Paula J, Keeler J. (2018). Atkin’s Physical Chemistry, 11th edn. (Oxford Universty Press, Oxford).
- Brown TL, LeMay HE, Bursten BE, Murphy CJ, Woodward PM, Stoltzfus MW. (2017). Chemistry-The Central Science: Dispon´ıvel em Map: Chemistry - The Central Science (Brown et al.) - Chemistry LibreTexts.
- Callen HB. (1985). Thermodynamics and an Introduction to Thermosthatics, 1st. edn. (JohnWiley Sons, Nova Jersey).
- de Oliveira MJ. (2023). Termodinamica, 2 edi¸cao (Editora Livraria da F´ısica, Sa˜o Paulo,).